
![]() GitHub |
GitHub | ![]() GitLab mirror | Preprint
GitLab mirror | Preprint
Report Notebook
The Report Notebook provides an interactive summary of CABS-flex simulation results. It can be generated with the --generate-notebook option and is intended as a convenient entry point for inspecting the main outputs without manually opening multiple files from the output directory.
The report is generated in two formats:
* report.html — a static HTML report that can be opened directly in a web browser;
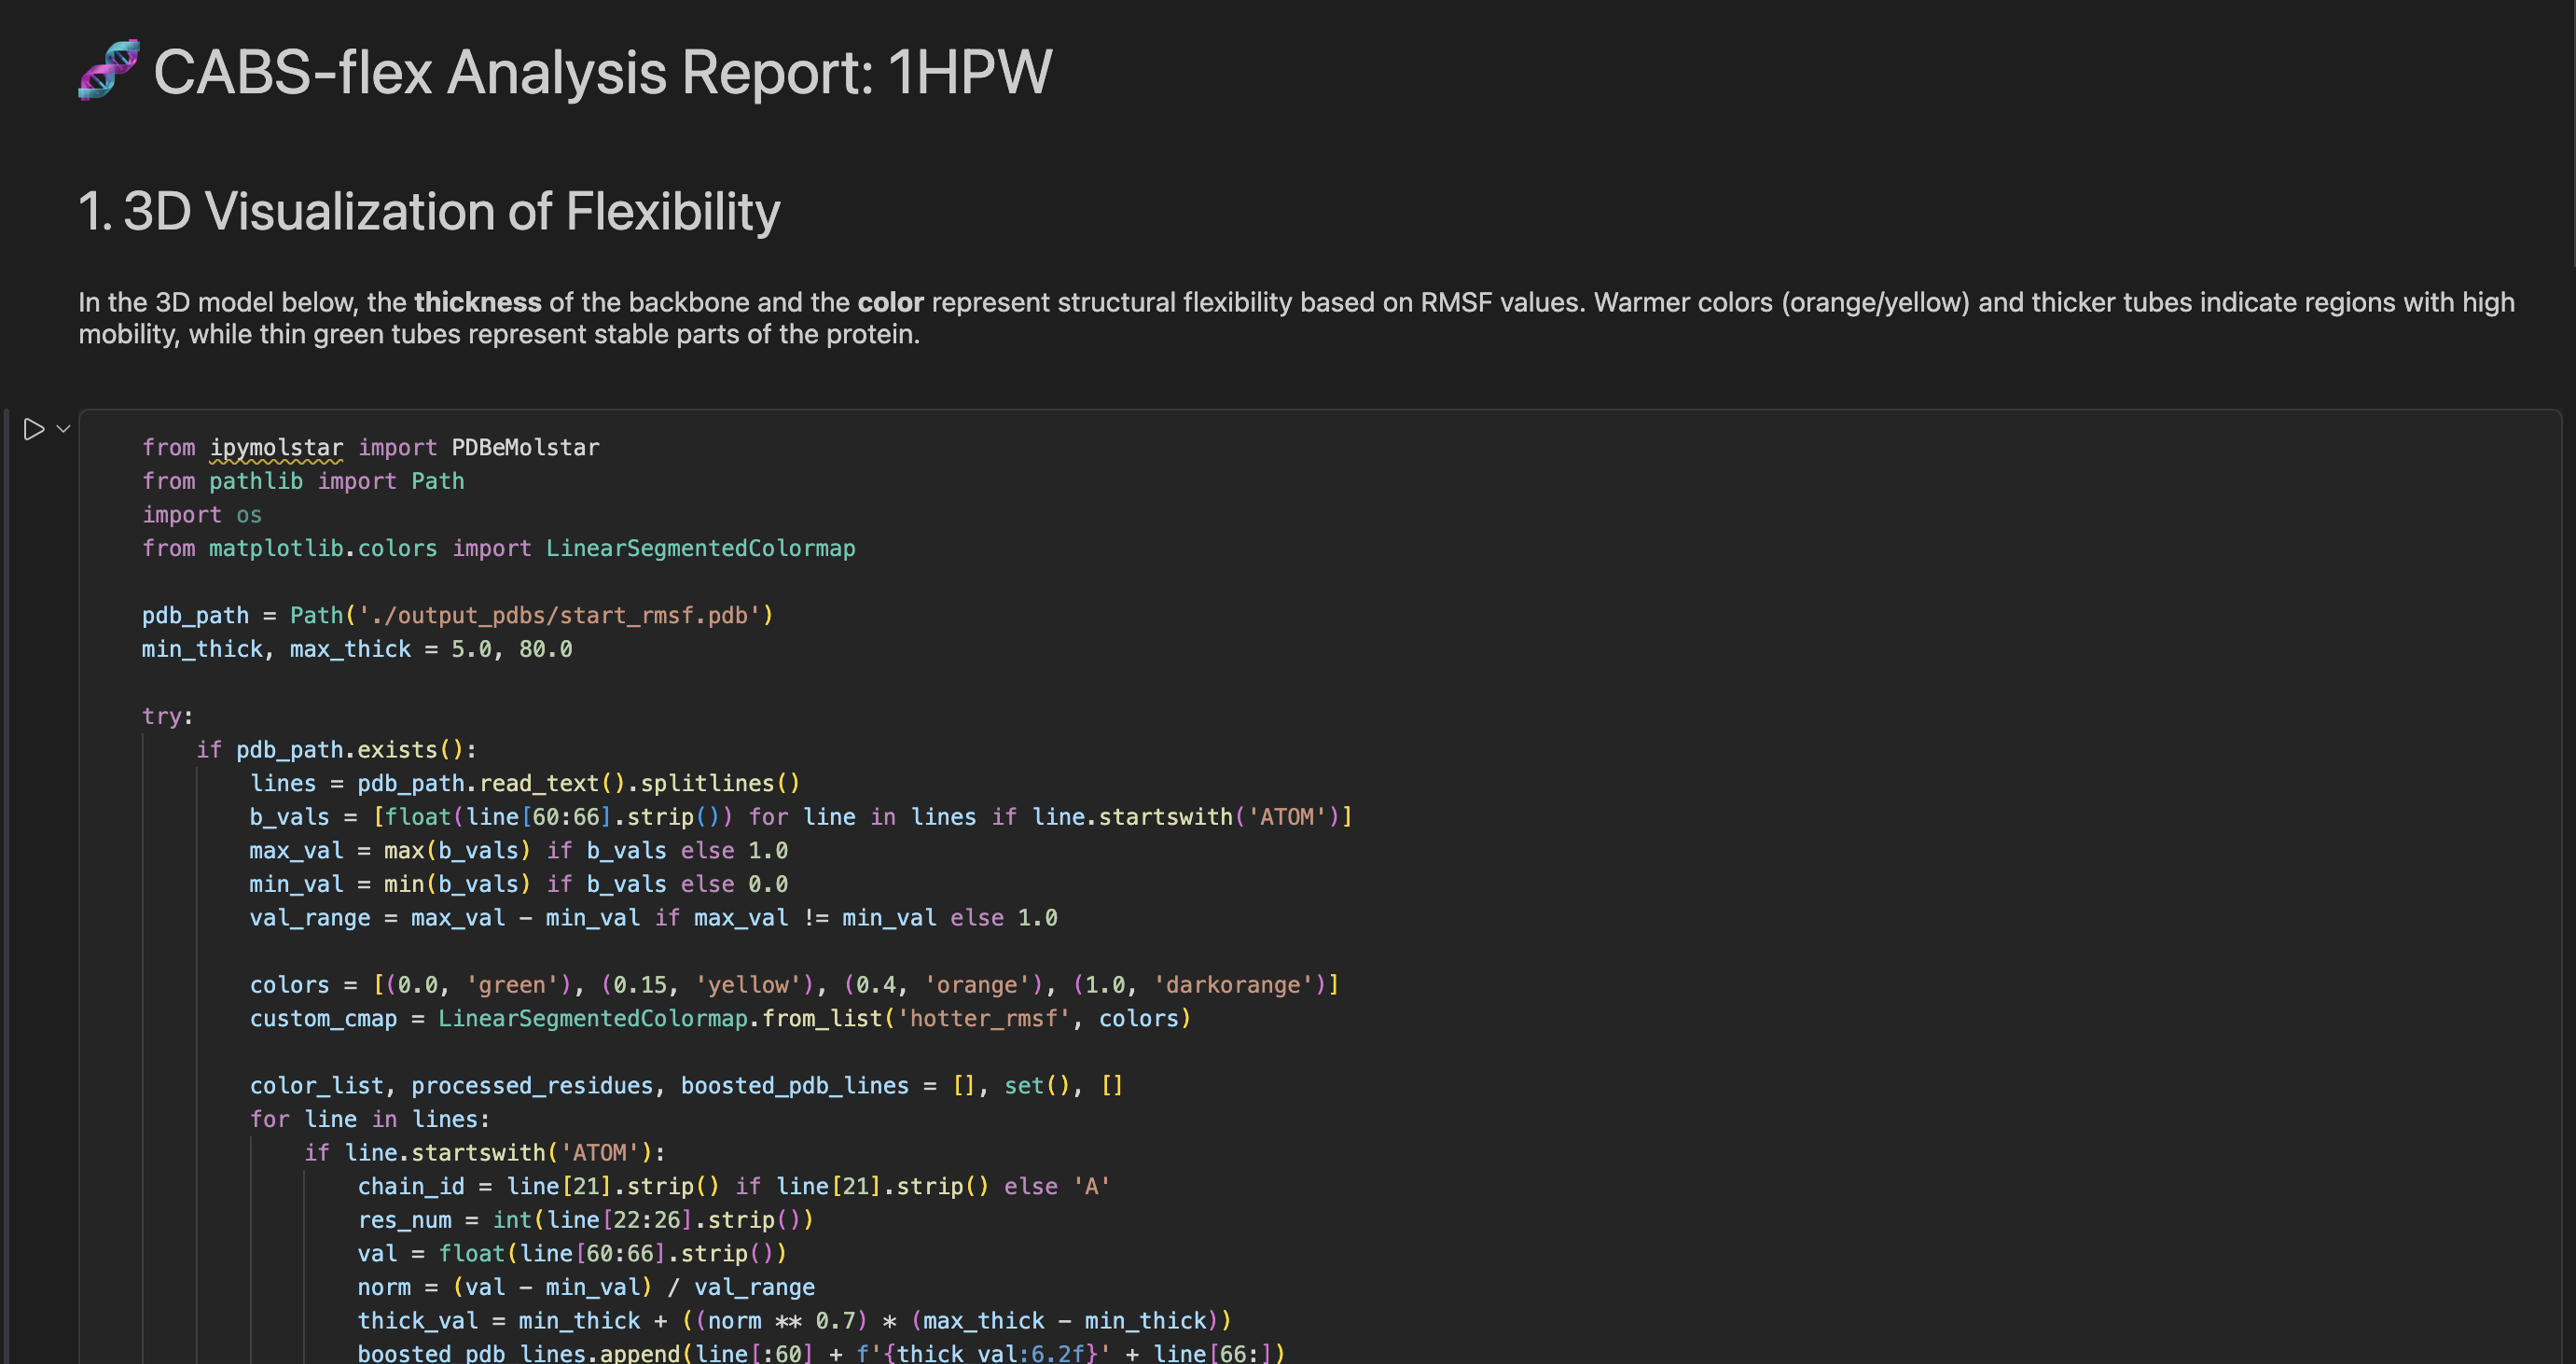
* report.ipynb — a Jupyter Notebook containing editable code for interactive visualization and custom analysis.
Depending on the workflow or output naming scheme, the notebook file name may include the input protein or PDB code.
Generating the report
To generate the report, add the --generate-notebook option to the command:
CABSflex -i 2gb1 --generate-notebook
After the run finishes, open the HTML report in a browser or open the notebook in JupyterLab / Jupyter Notebook.
Report contents
The report contains three main analysis sections: 3D protein visualization, RMSF plots, and contact maps.
3D visualization of flexibility
The report includes an interactive 3D structure viewer based on Mol* / Molstar. The protein is displayed using a flexibility-aware putty representation, where color and thickness indicate local mobility. This makes it easier to identify rigid regions, flexible loops, mobile termini, and other parts of the structure with increased conformational variability.
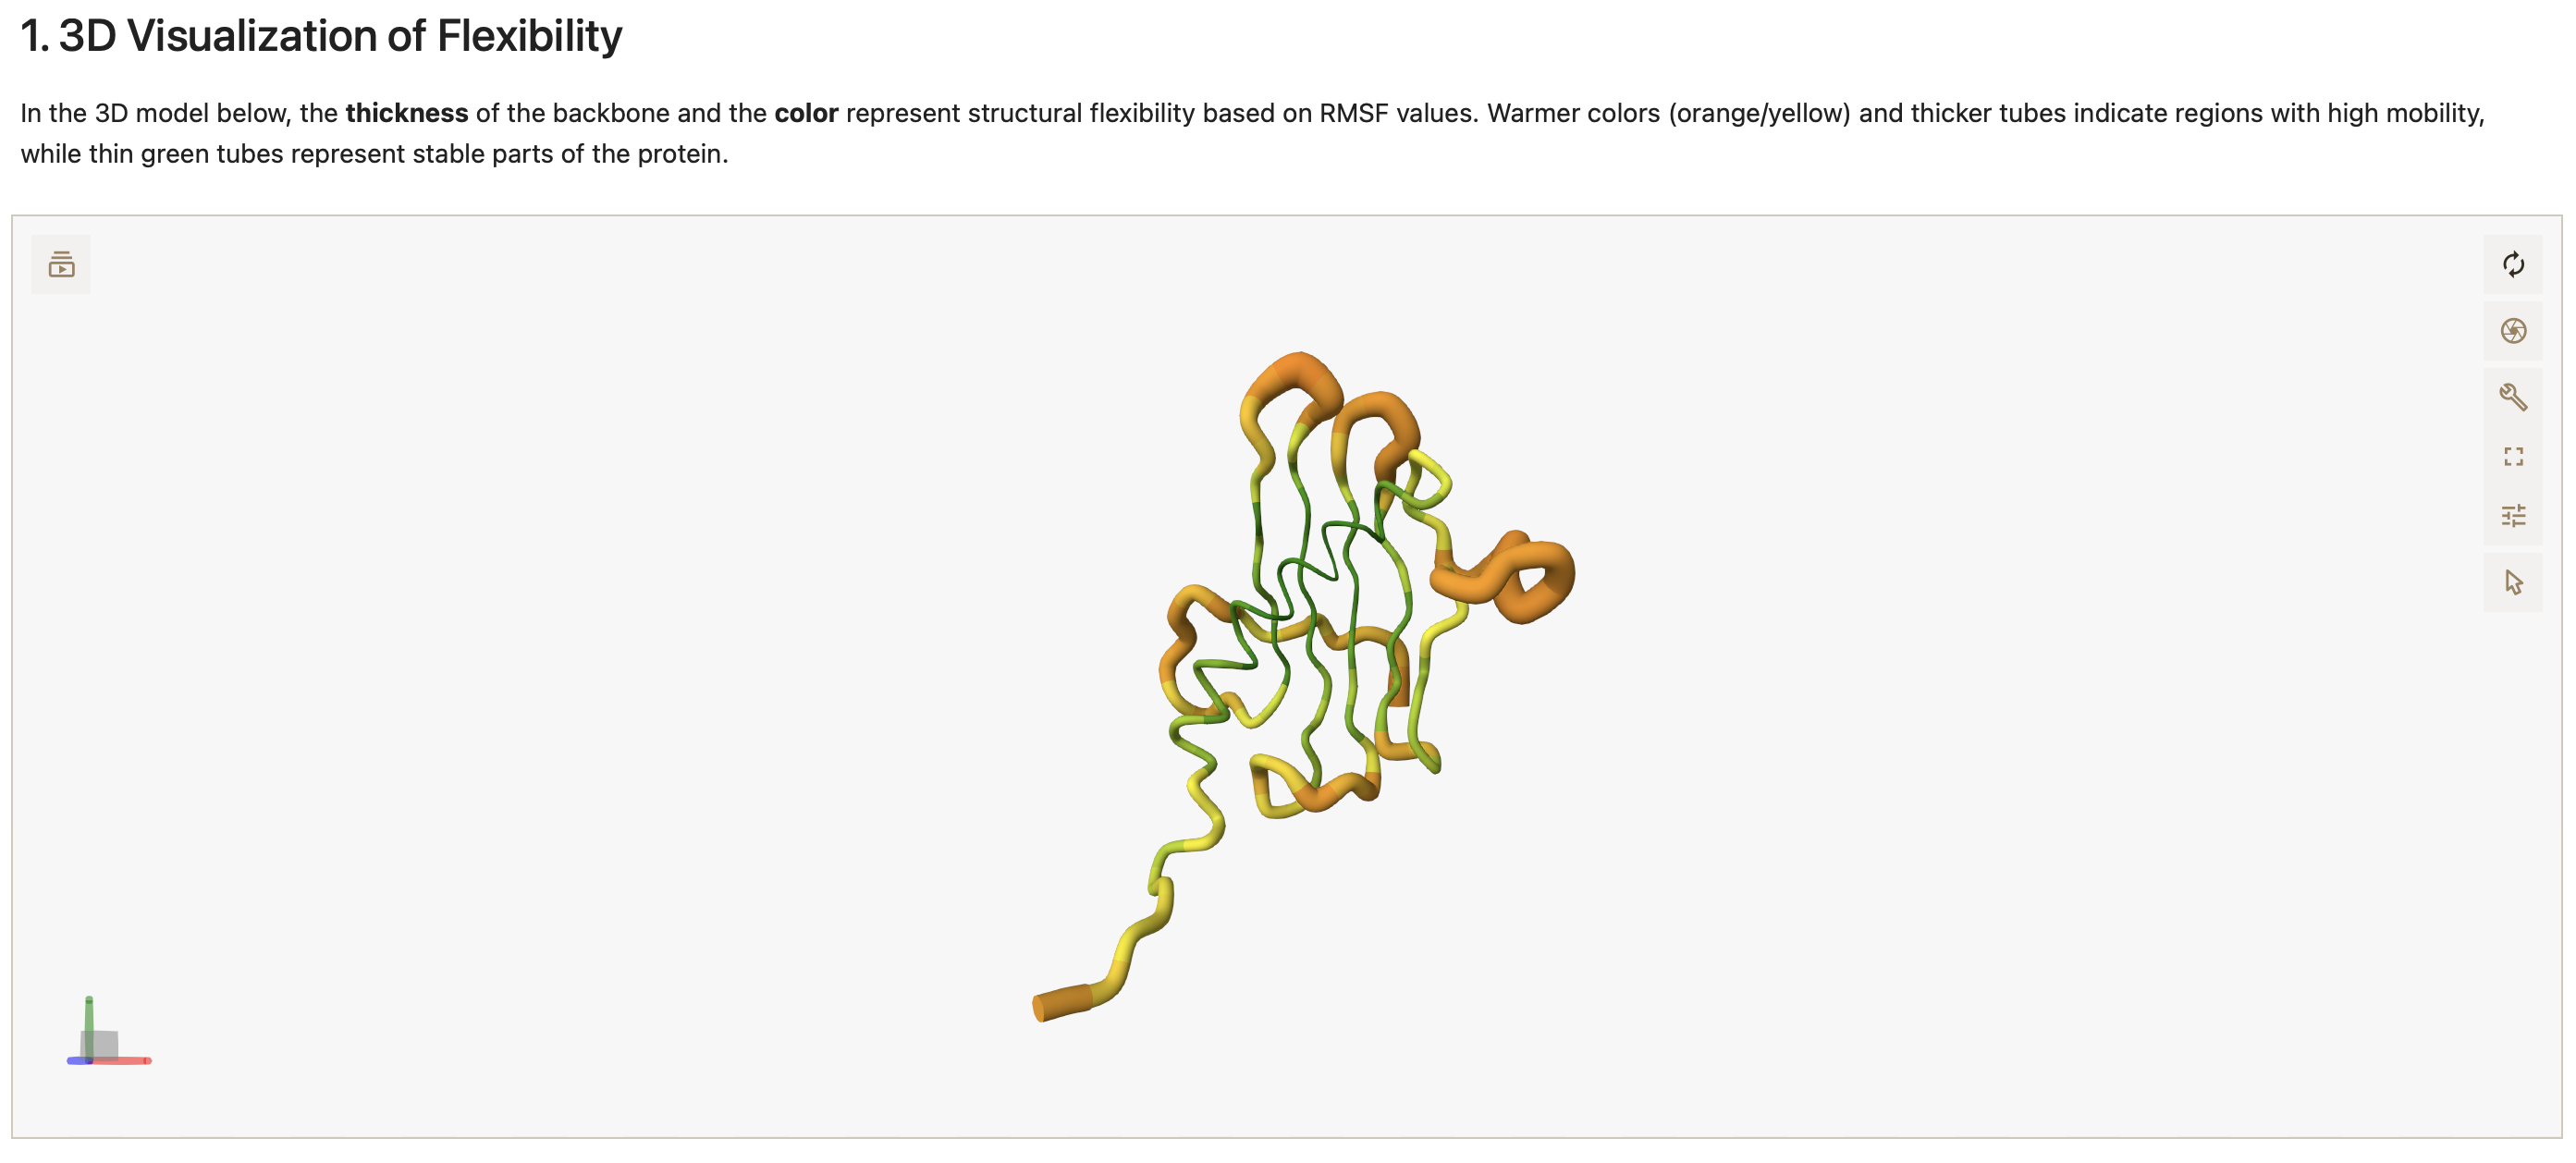
Figure 1. Interactive 3D visualization of protein flexibility in the Report Notebook. The structure is shown in a putty-style representation, where color and thickness indicate relative mobility of different protein regions.
RMSF plots
The report includes RMSF plots showing residue-level fluctuations. Separate plots are provided for individual protein chains, making it possible to inspect which residues or regions fluctuate most strongly during the simulation. These plots are useful for identifying flexible loops, mobile termini, and rigid structural regions, as well as comparing flexibility patterns between chains.
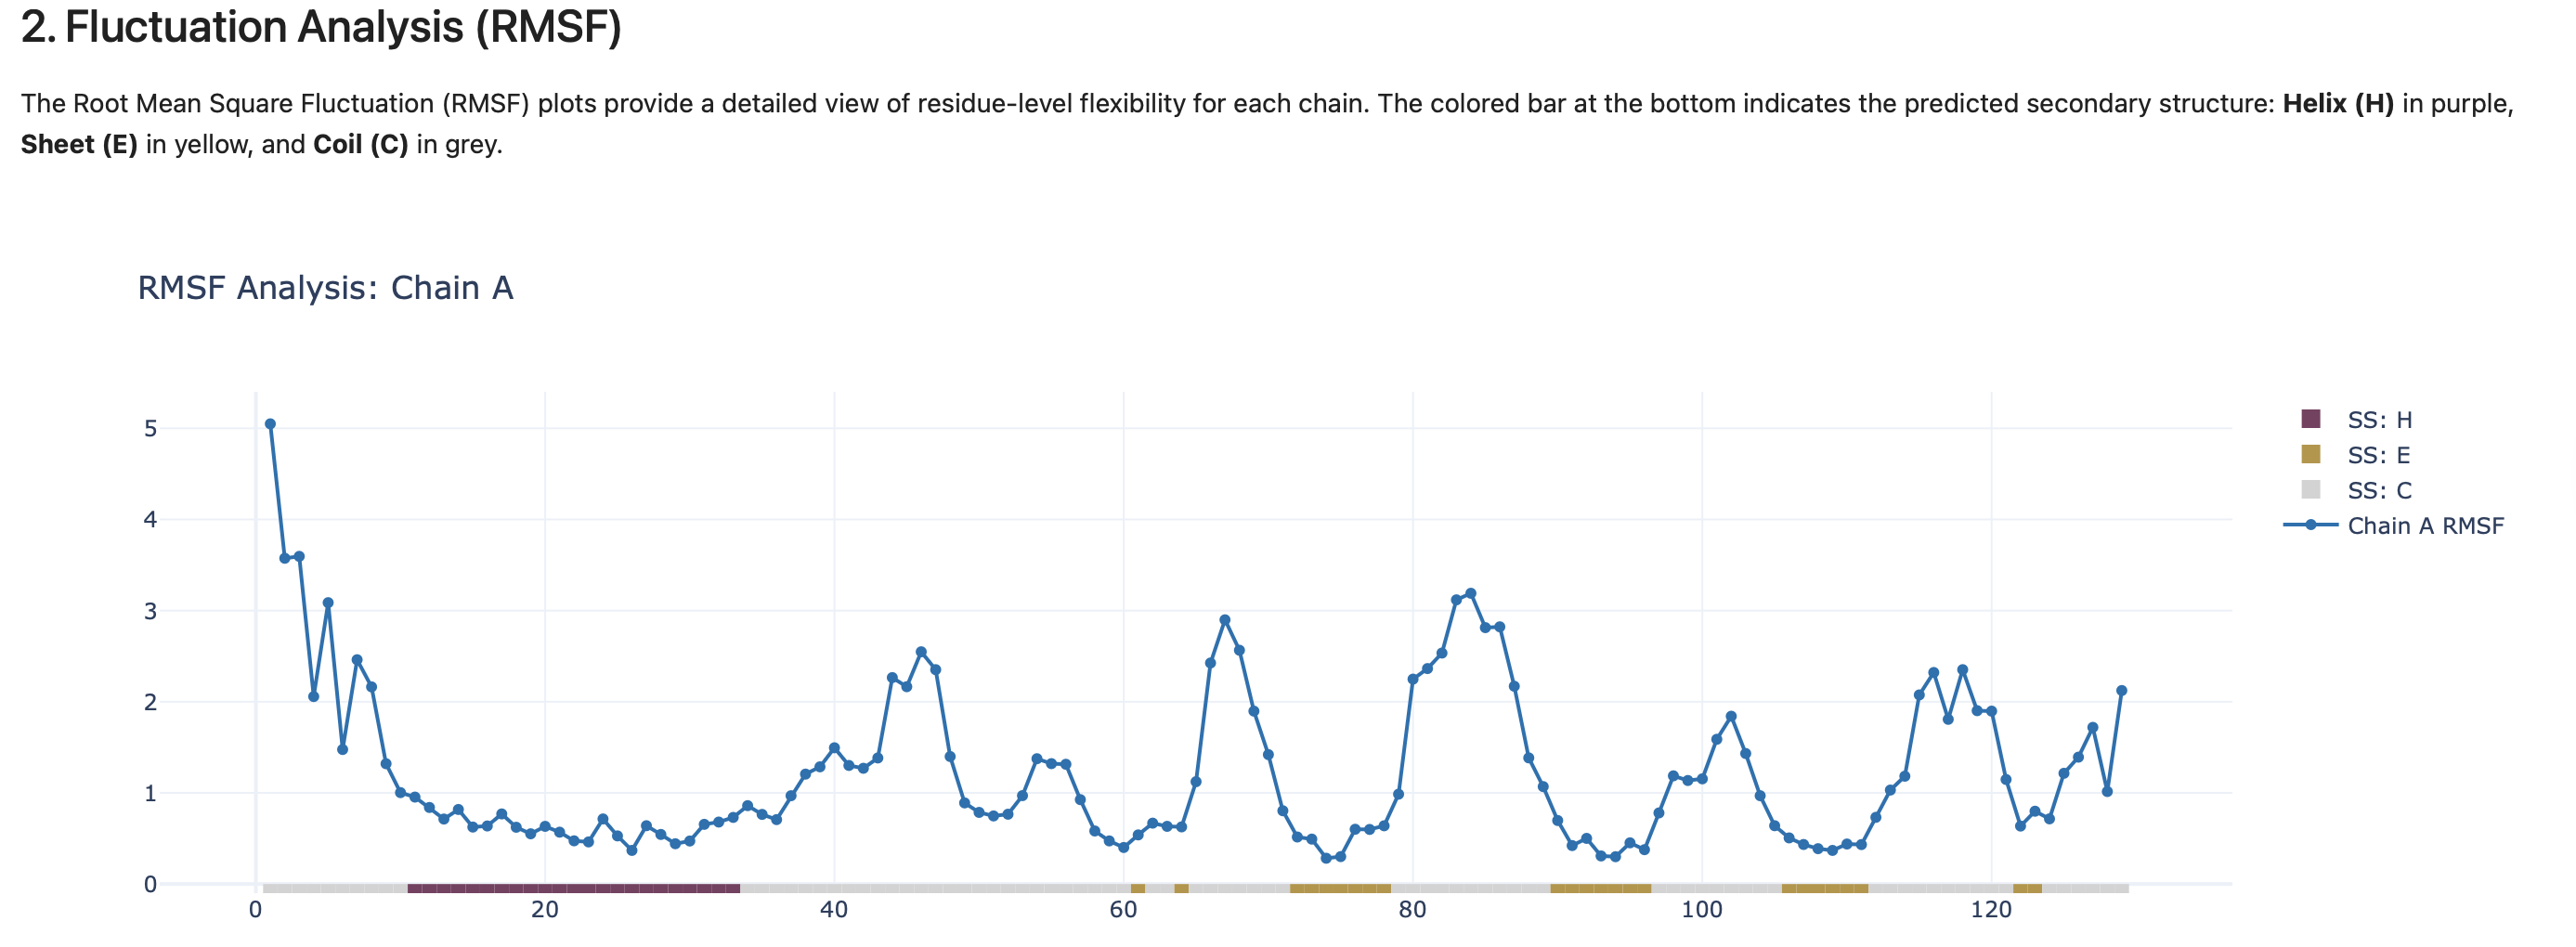
Figure 2. RMSF plot generated in the Report Notebook. The plot shows residue-level fluctuations and helps identify the most flexible and most rigid regions of the protein.
Contact maps
The report includes contact maps showing residue–residue interaction patterns observed during the simulation. Contact maps can help identify stable contacts, flexible regions, and changes in interaction patterns across the simulated ensemble.
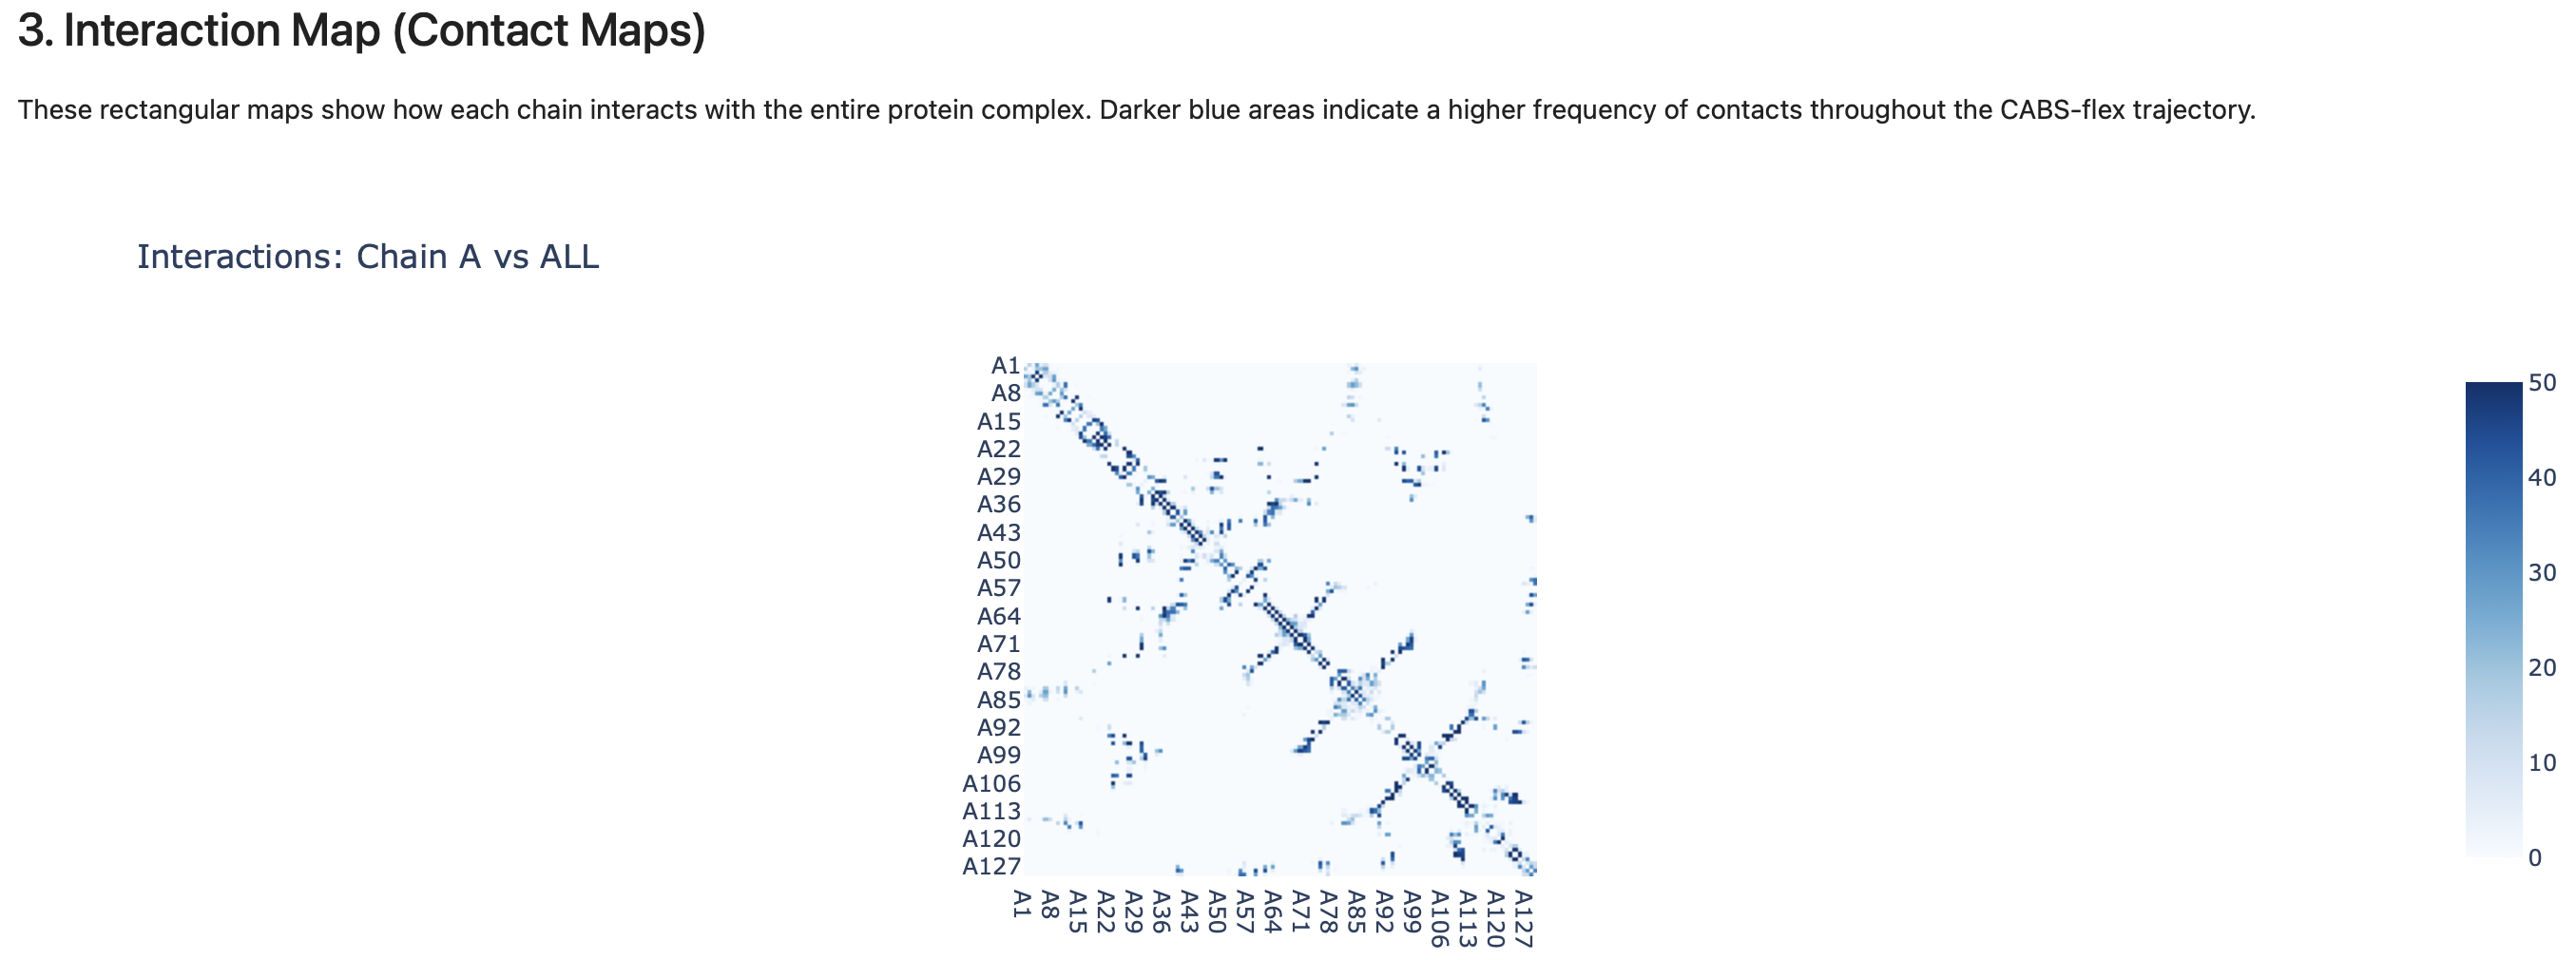
Figure 3. Contact map generated in the Report Notebook. The heatmap summarizes residue–residue contact frequencies observed during the simulation.
Custom analysis
The Jupyter Notebook version of the report contains modifiable code. Users can edit and re-run notebook cells to customize the visualization, modify plots, extract additional information, or adapt the analysis to their own workflow.
The notebook is therefore not only a static report, but also a starting point for reproducible and customizable analysis of CABS-flex results.
Open development
The Report Notebook functionality is open and intended to be further developed. Users and developers are encouraged to extend this part of the package by adding new analysis panels, improving visualization, adapting the notebook to specific workflows, or integrating additional outputs from CABS-flex and CABS-dock simulations. This makes the Report Notebook a flexible interface between standard CABS-flex output and user-defined downstream analysis.
← Visualization Guide | ⬆ Back to top | Next: Options