
![]() GitHub |
GitHub | ![]() GitLab mirror | Preprint
GitLab mirror | Preprint
Visualization Guide
Visualizing the results of CABS-flex and CABS-dock simulations is essential for interpreting the conformational ensembles and binding poses.
Recommended Tools
PyMOL
PyMOL is the standard tool for high-quality rendering and movie generation.
- Ensemble Visualization: Load the 10 models from
output_pdbs/as states in a single object. - Flexibility Mapping: Color the structure by B-factor to visualize the RMSF data (B-factors in the output models correspond to local fluctuations).
Mol* (Molstar)
A web-based viewer suitable for quick inspection without installation.
- Drag and drop
output_pdbs/model_1.pdbor the trajectoryreplica_1.pdb.
UCSF Chimera / ChimeraX
Useful for handling trajectories and performing detailed structural analysis.
Visualization Scripts
The CABSflex package provides three main flags to automate the preparation of visualization files and analysis reports:
--generate-pymol-visualizations
Generates a set of PyMOL script files (.pml) in the working directory to automate common visualization tasks:
load_models.pml: Loads all generated models and aligns them to the first one.color_by_ss.pml: Colors the structure by secondary structure (using CABS-assigned values).color_by_rmsf.pml: Colors the structure by B-factors (representing local fluctuations/RMSF).animate_models.pml: Loads models into a single object as states for easy animation.load_restraints.pml: Visualizes the distance restraints used during the simulation.
--generate-chimera-visualizations
Generates ChimeraX command scripts (.cxc) for high-quality analysis:
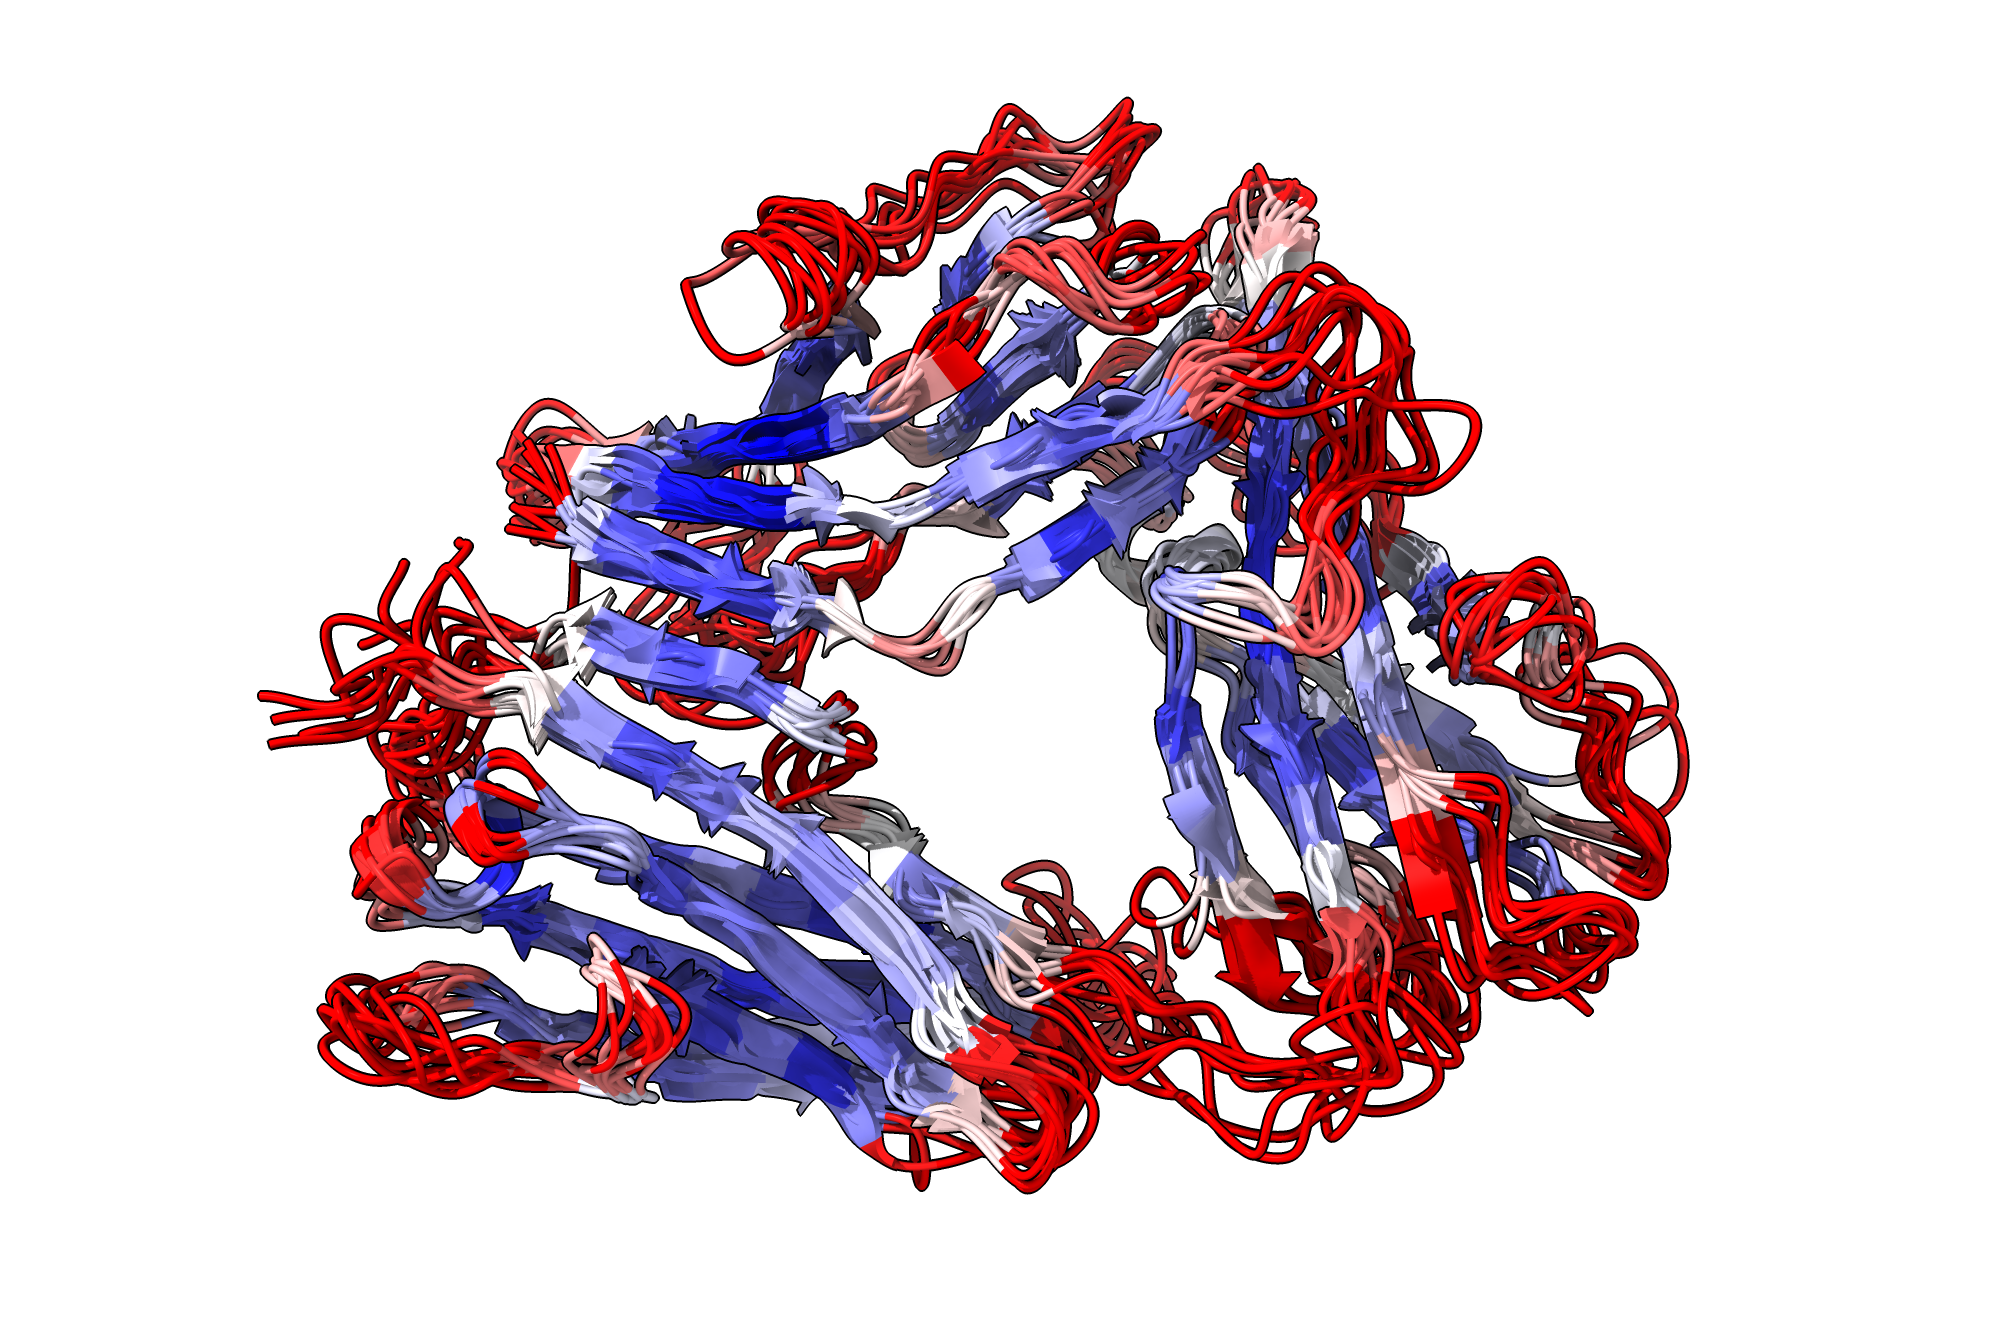
color_rmsf.cxc: Maps RMSF data onto the structure using a color gradient. Example visualization generated by the script is shown below:
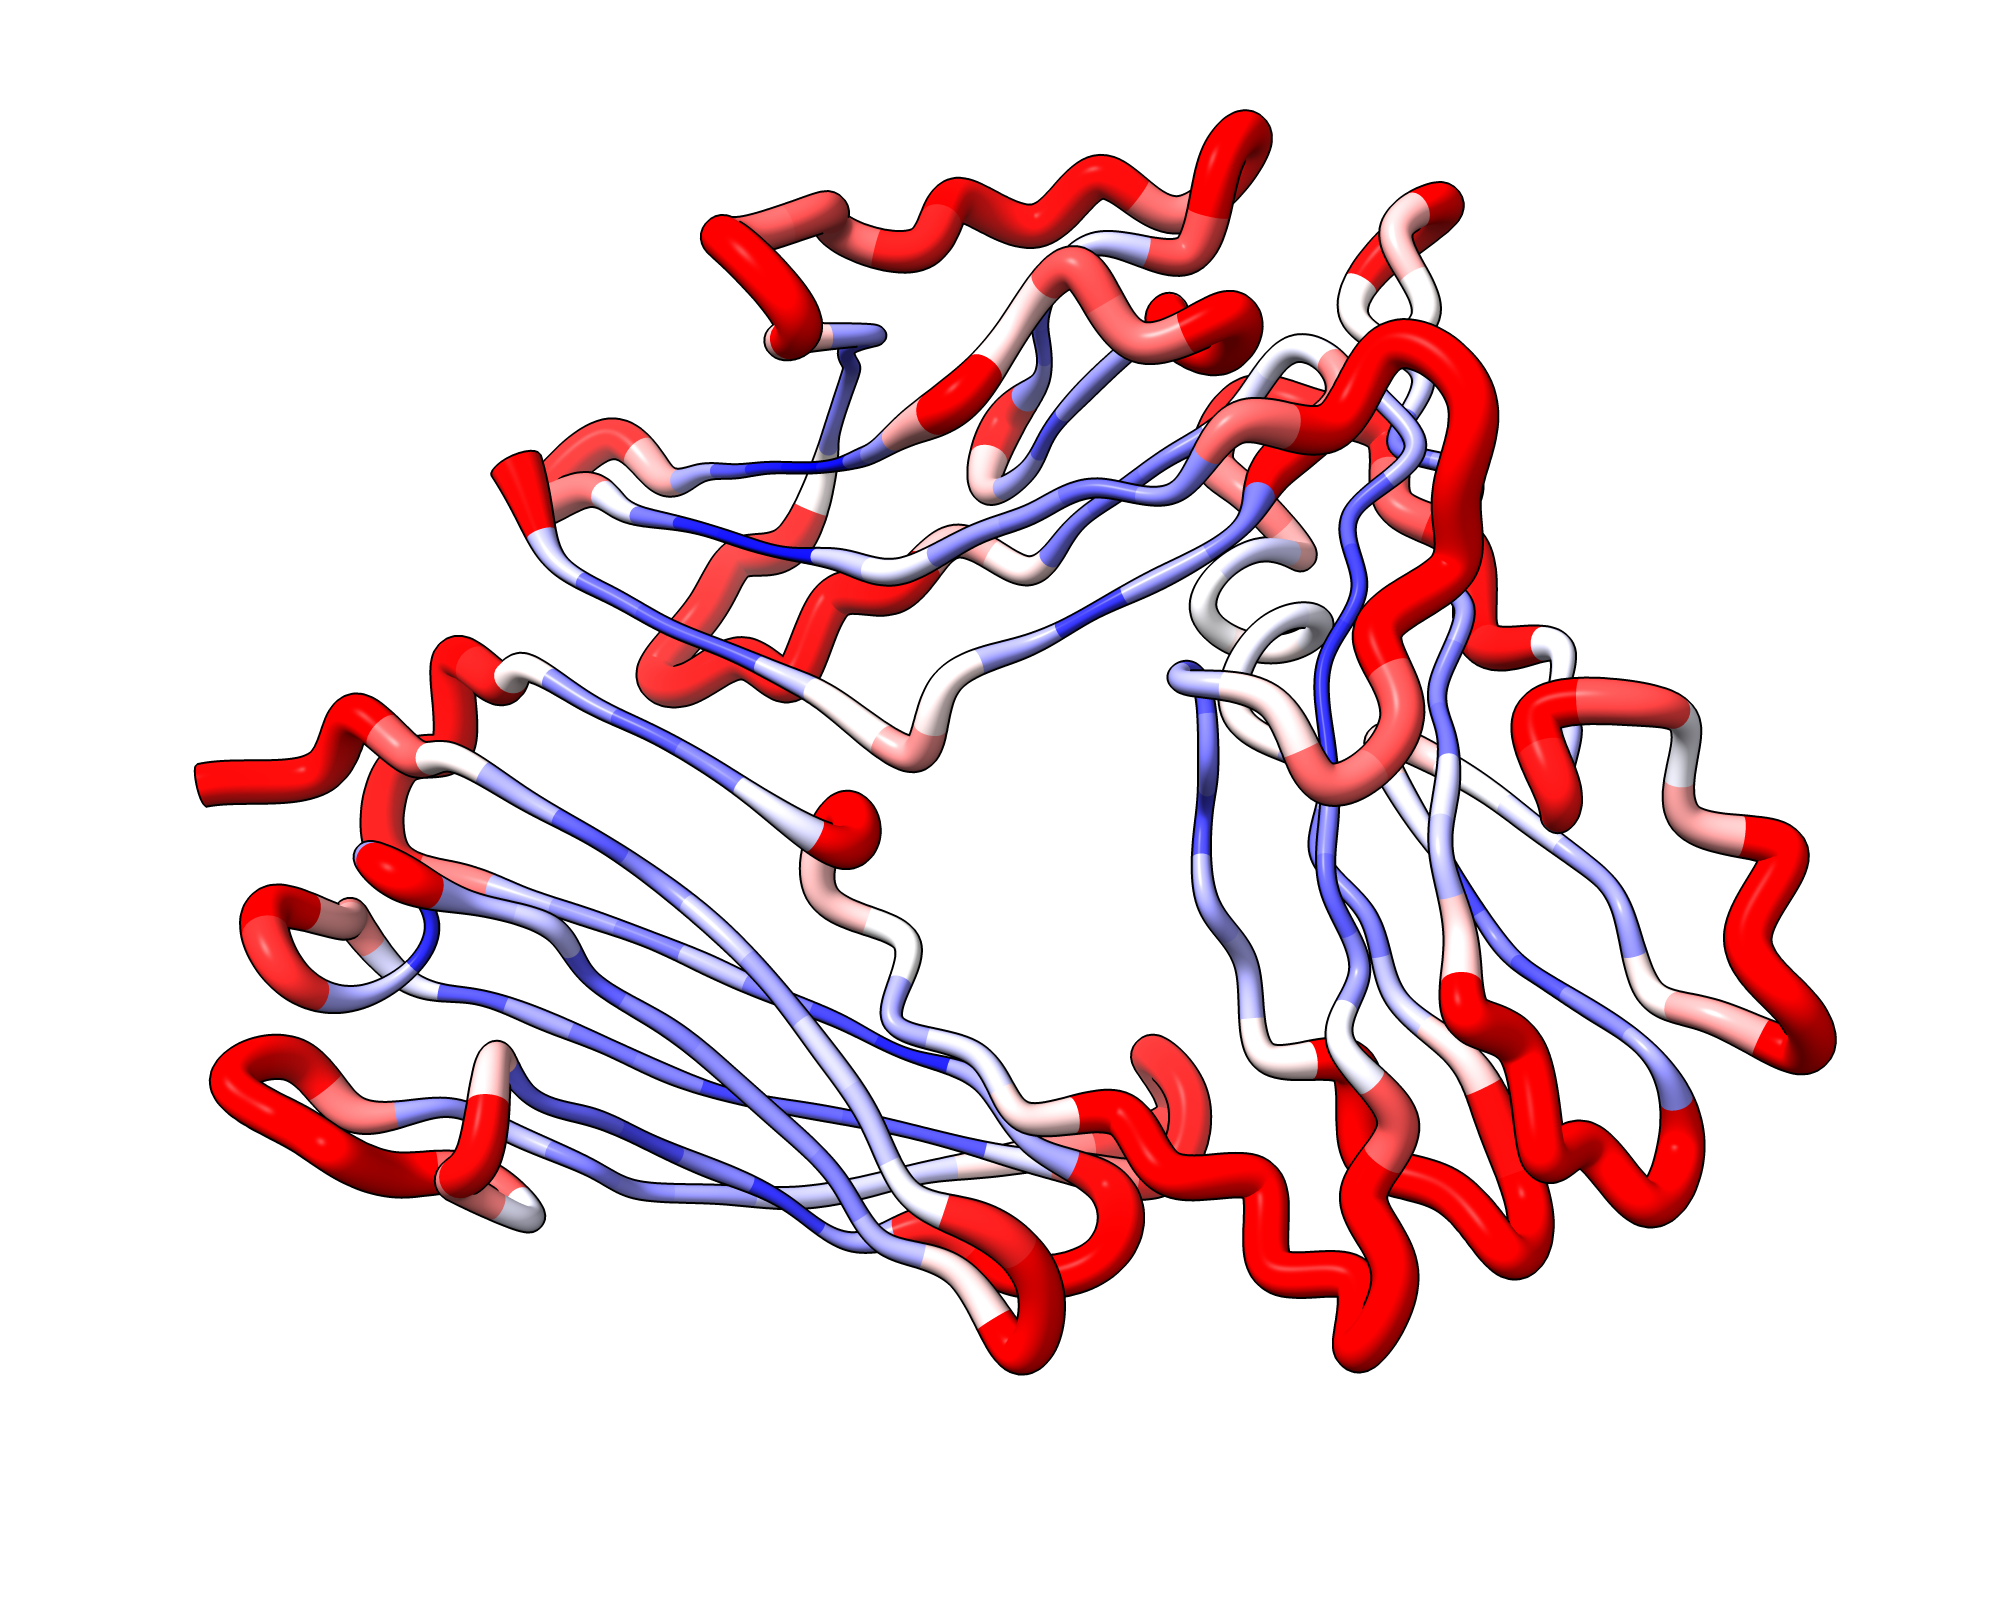
rmsf_worm.cxc: Displays the protein as a "worm" where the thickness corresponds to flexibility. Example visualization generated by the script is shown below:
-
record_movie.cxc: A template script to automate recording a spinning animation of the ensemble. Example spin movies generated by the script can be found on the Examples page. -
make_movies.py(CABSdock only): A standalone Python script generated in the working directory after a CABS-dock run with--generate-chimera-visualizations.
Prerequisites: chimerax and ffmpeg must be available in PATH.
Run with python make_movies.py from the working directory to produce movies and snapshots in the movies/ subdirectory:
Top_10_Models.mp4— 360° rotation of the top 10 clustered docking models overlaid on the receptor.Trajectory_N.mp4— full trajectory animation for the best-scoring replica.Total_Energy_vs_RMSD.mp4/Interaction_Energy_vs_RMSD.mp4— animated energy-vs-RMSD scatter plots.Combined_Trajectory_N_Total_Energy_vs_RMSD.mp4/Combined_Trajectory_N_Interaction_Energy_vs_RMSD.mp4— side-by-side trajectory and energy plot.-
snapshots/top10_snapshot_1–10.png— 10 snapshots of the top models at 36° intervals. -
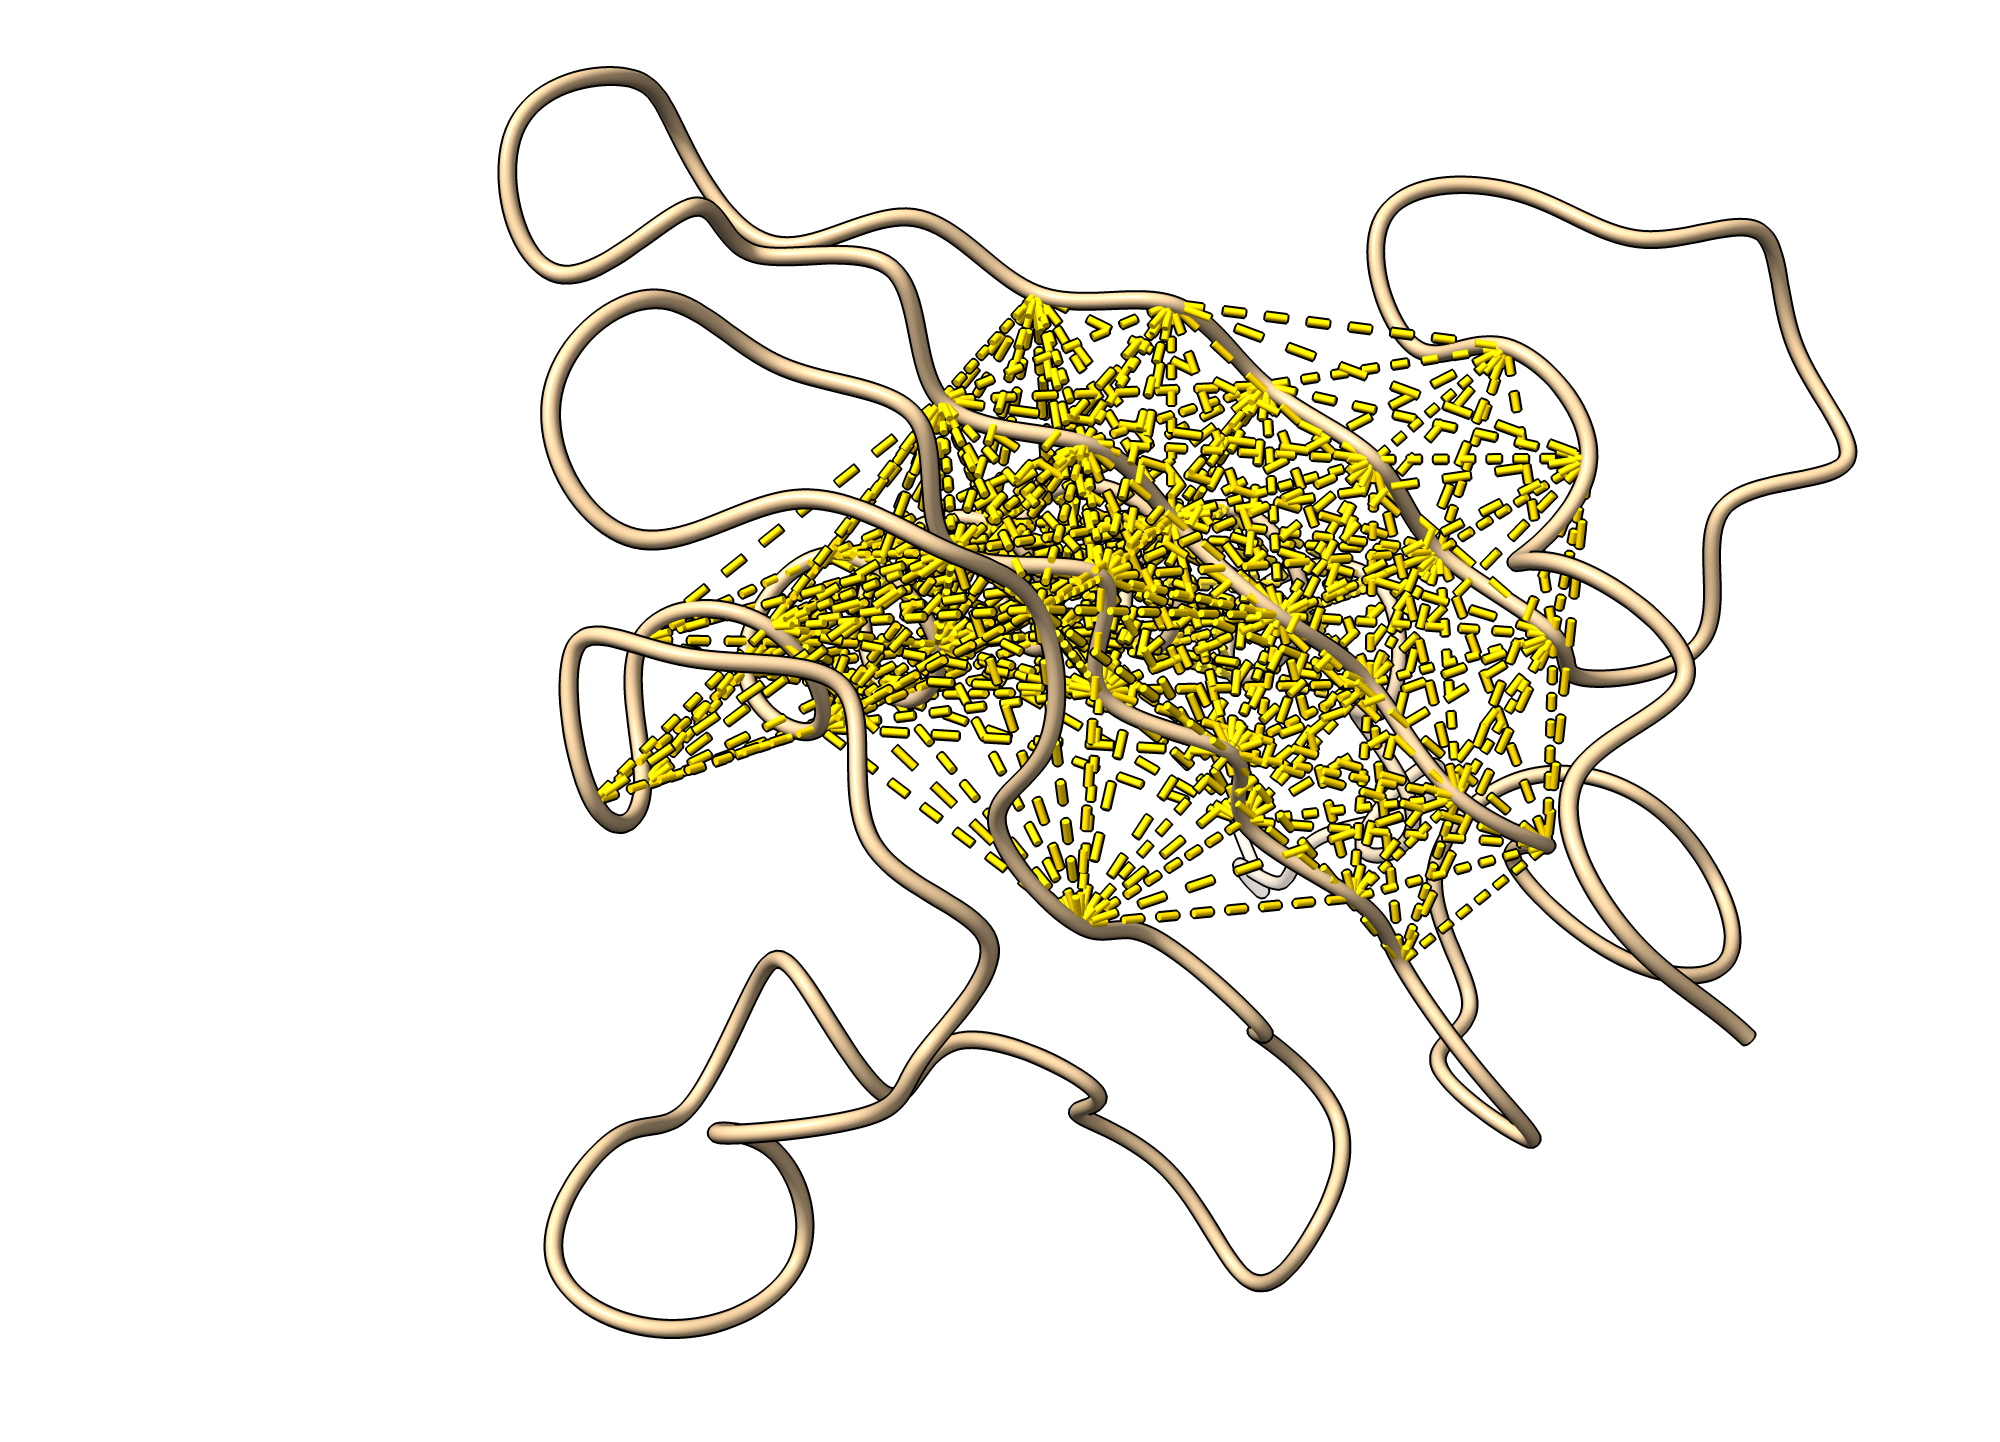
load_restraints.cxc: Visualizes restraints as distance monitors in ChimeraX. Example visualization generated by the script is shown below:
--generate-notebook
Generates a comprehensive Jupyter Notebook (report.ipynb) and an HTML report (report.html) in the working directory. The report includes:
- Interactive 3D View: A Mol* (Molstar) viewer integrated into the notebook, showing the structure colored by flexibility with a "putty" representation.
- RMSF Plots: Dynamic, interactive plots (using Plotly) showing fluctuations per residue for all chains.
- Contact Maps: An interactive heatmap of residue-residue contact frequencies.
More information can be found on the Generating Report page.
Tips for Better Visualization
- Smoothing: Use PyMOL's
smoothcommand for trajectories to reduce coarse-grained artifacts. - Coloring: Use the
spectrumcommand in PyMOL to highlight flexible vs. rigid regions. - Surface representation: Showing the receptor surface with a transparent style can help visualize the peptide binding pocket in docking results.
For practical examples, see the Examples page.
← Command-line Options | ⬆ Back to top | Next: Generating Report